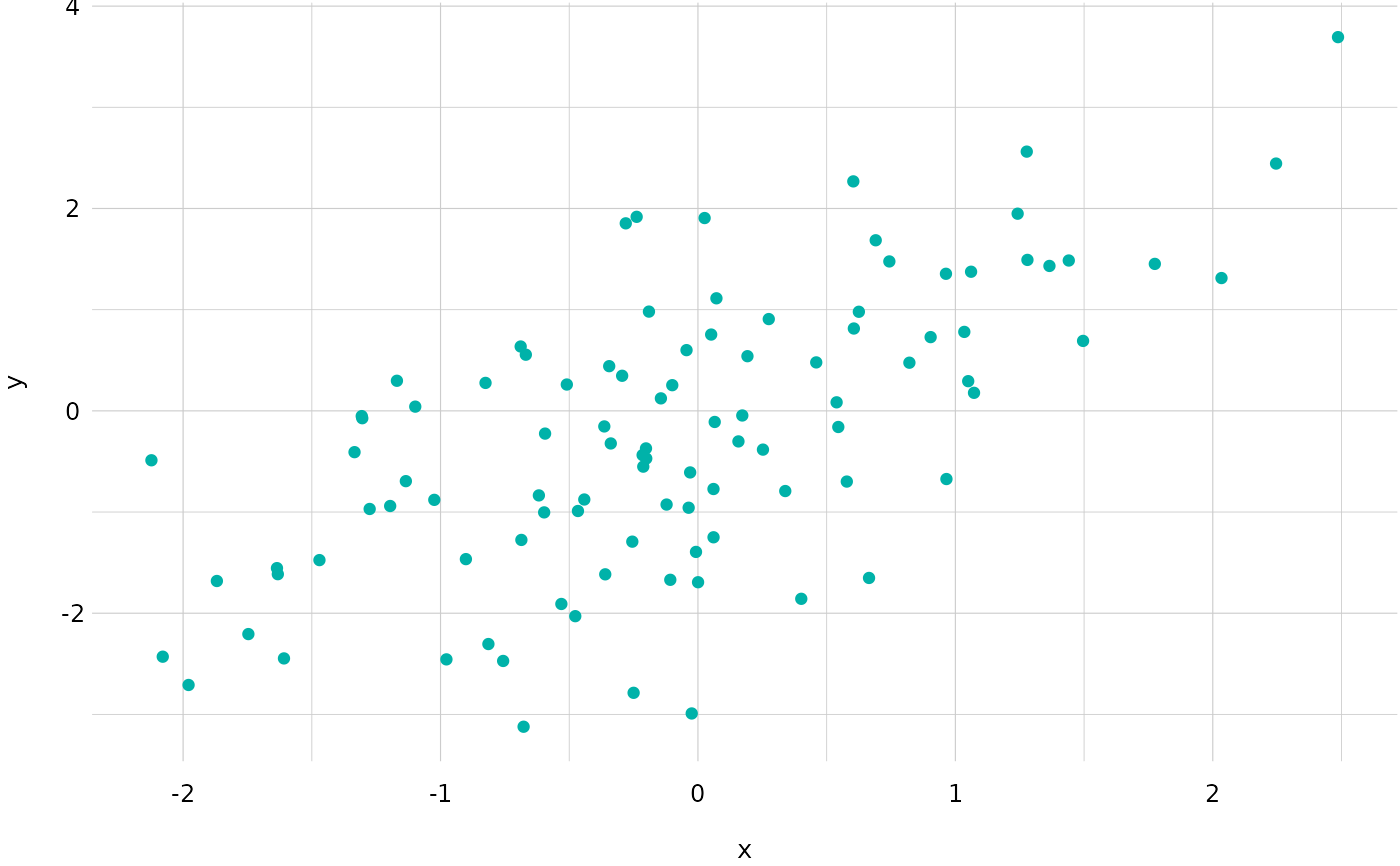
Generate a scatterplot
ksnet_scatter.RdExplore the distribution of your data with a scatterplot This function generates a ggplot2 object, so it's easily expanded with labels, themes, and other elements.
Uso
ksnet_scatter(data, xvar, yvar, color = color_ksnet()[1])Ejemplos
x <- rnorm(100)
y <-  rnorm(100, x, 1)
my_data <- data.frame(x = x, y = y)
ksnet_scatter(my_data, x, y)