Generate a histogram with ksnet styling
ksnet_hist.RdExplore the distribution of your data with a histogram. This function generates a ggplot2 object, so it's easily expanded.
Uso
ksnet_hist(data, xvar, fill = color_ksnet()[1])Ejemplos
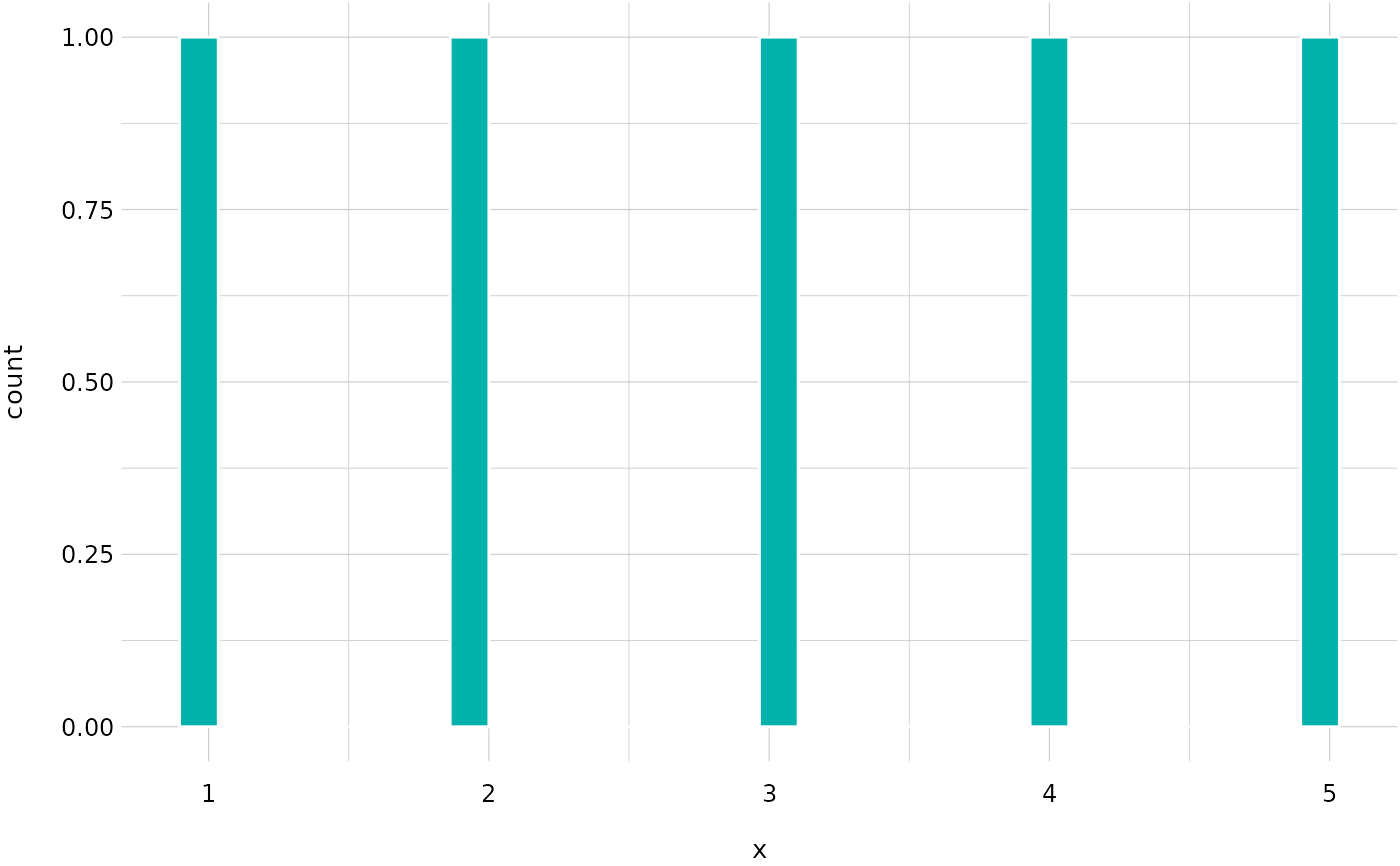
my_data <- data.frame(x = c(1,2,3,4,5))
ksnet_hist(my_data, x)
#> `stat_bin()` using `bins = 30`. Pick better value with `binwidth`.